The population profile for New Hampshire is often over-simplified; conversation typically revolves around New Hampshire’s population being predominantly rural, older, and White. Recently, we’ve seen this belief reflected in the current administration’s request of the Democratic National Committee (DNC) to move away from New Hampshire, and it’s first-in-the-nation presidential primary because of our lack of diversity and their desire to “ensure that voters of color have a voice in choosing our nominee much earlier in the process and throughout the entire window”, putting New Hampshire second-in-line after South Carolina.
While data supports those generalizations, these opinions lack a general understanding of our local communities and diminishes the value in digging deeper and understanding the more complex and nuanced stories that emerge when looking at the almost 1.4 million people who live, work, play and pray in the Granite State.
A newly released brief from the New Hampshire Center for Justice and Equity summarizes NH’s race and ethnicity demographics data. The brief uses data from a variety of resources, including the NH Department of Health and Human Services’ Health Data Portal, NH Office of Strategic Initiatives, Annie E. Casey Foundation’s Kids Count Data Center, and United States Census Bureau. This is the first in a series of briefs planned to describe New Hampshire.
Race and ethnicity demographics findings include:
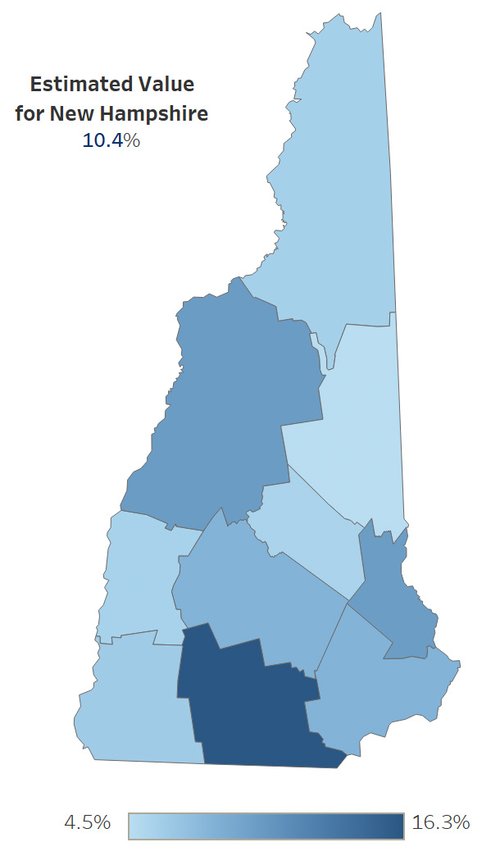
“Total Black, Indigenous, Persons of Color (BIPOC), New Hampshire, 2016-2020 US Census”
Just over 10% (10.4%) of the population in New Hampshire is Black, Indigenous, and Persons of Color (BIPOC), according to the US Census data collected from 2016-2020, and 89.6% of the population is White. The percentage of people who are BIPOC increased over 3% in the past 10 years.
Just under 5% (4.7%) of the population is Hispanic, according to the 2016-2020 estimates, and 95.3% of the population is not Hispanic. The percentage of people who are Hispanic increased almost 2% in the past 10 years.
The BIPOC and Hispanic populations (approximately 141,000 and 63,000 people, respectively) live all around New Hampshire. For example, 4.5% of people in Carroll County and 16.3% of people in Hillsborough County are BIPOC. Images are from the NH Health Data Portal.
The US Census Bureau uses the Diversity Index as a summary measure, which indicates how likely that two random people will be from different racial or ethnic groups. New Hampshire’s Diversity Index has increased over time, from 15% in 2010 to 24% in 2020; increases in the Diversity Index occurred in every NH County.
The Annie E. Casey Kids Count Data Center reporting of race and ethnicity indicates that the NH population under 18 are more diverse than the state overall. The Kids Count Data Center provides age specific estimates, which show that children under 18 range from 16-18% BIPOC and/or Hispanic (using US Census Bureau estimates from 2016-2020).
These data show that, despite being one of the least diverse states in terms of race and ethnicity demographics, NH’s BIPOC and Hispanic populations are increasing in number in New Hampshire. Having a state that is welcoming and supportive to people from all backgrounds will allow New Hampshire to stay well, productive, and competitive.
Download report here.