New data released by the U.S. Census Bureau provide key insights into the economic well-being of Granite Staters. The American Community Survey’s 2023 state-level data showed that median household income recovered to 2021 levels after adjusting for inflation, following a decline in 2022. While the median household income increased, the poverty rate held steady at 7.2 percent, reflecting that nearly 100,000 New Hampshire residents had very little income despite purchasing power growing for the median household.
Household Incomes
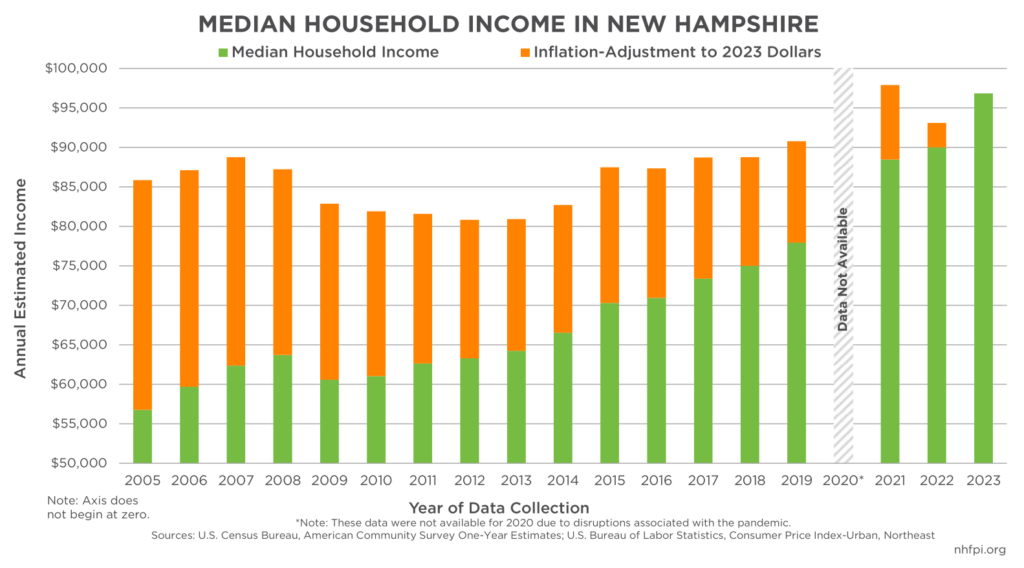
The estimated median household income in New Hampshire was $96,838, based on data collected by the American Community Survey during 2023. This median income estimate increased from the $89,992 estimated for 2022, even after adjusting for inflation and accounting for statistical uncertainty. After taking inflation into account, the median household income effectively rebounded to about 2021 levels; in 2022, median household income fell behind inflation, and spending power dropped relative to 2021. The 2023 data show this median income recovered to 2021 levels after the inflation adjustment of 2021 dollars to 2023 purchasing power. The inflation-adjusted 2023 household incomes were higher than before the COVID-19 pandemic and prior to the Great Recession of 2007-2009, and reflected the relative speed of the post-pandemic recovery compared to the slow recovery from the Great Recession.
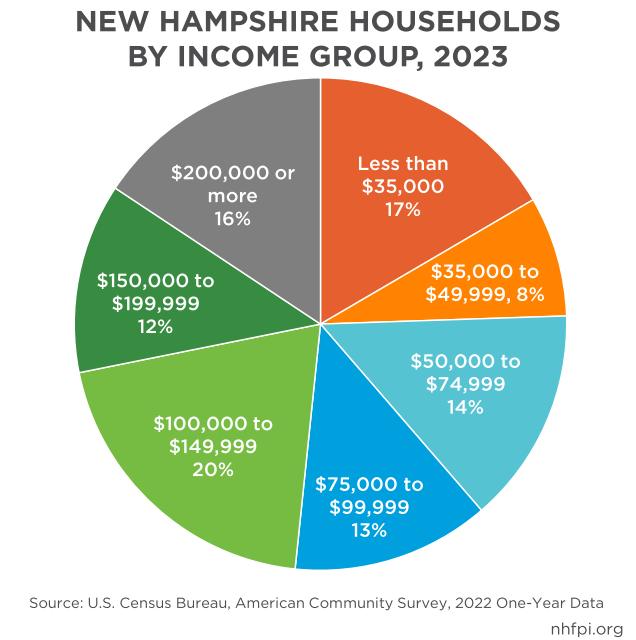
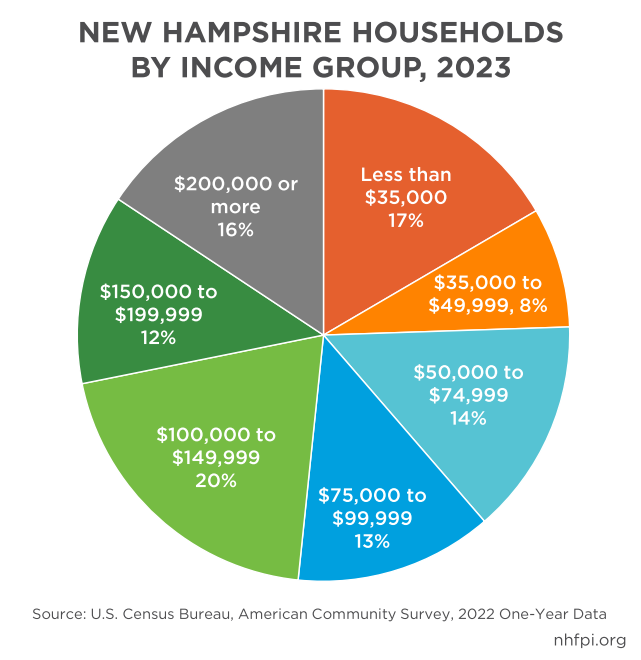
Of the estimated 569,493 households in New Hampshire in 2023, 25 percent, or one in four, had pre-tax incomes below $50,000 annually. About 17 percent had incomes lower than $35,000, and nearly 11 percent had estimated incomes below $25,000 during 2023. About 48 percent had incomes over $100,000, and almost 16 percent had incomes of $200,000 or more.
The average household size in New Hampshire was 2.39 people in the 2023 data. The Massachusetts Institute of Technology estimated the living wage income for a two-person household in New Hampshire in 2024 was $67,155 for two adults, $88,074 for one adult with one child, and $97,876 for two working adults with one child. The Economic Policy Institute estimated the income a family needed in 2024 for a “modest yet adequate standard of living,” which does not include costs such as paying for student loans or for homeownership as well as for any form of entertainment, ranged from $72,501 to $94,597 for a household with two adults and one child, depending on where they lived in New Hampshire.
Poverty in New Hampshire
The U.S. Census Bureau calculates poverty thresholds for different household sizes. The Official Poverty Measure poverty threshold is not adjusted for changes in living costs between the 48 contiguous United States; other measures of hardship differ, such as the regional housing cost variations incorporated into the Supplemental Poverty Measure. The Official Poverty Measure thresholds for 2023 are $15,852 for a single person under 65 years old, $21,002 for a two-person household with one child and one adult under 65, $24,526 for a three-person household with one child, and $30,900 for a four-person household with two children.
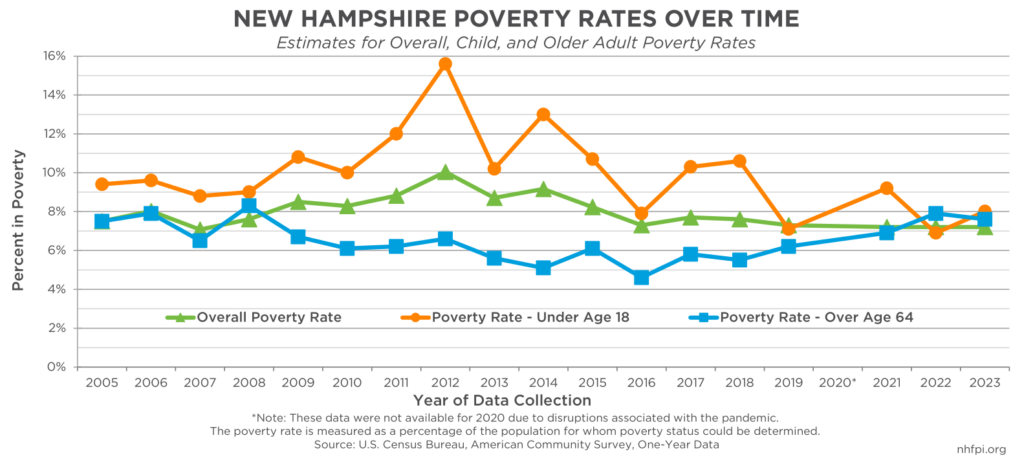
An estimated 98,000 people lived with incomes below Official Poverty Measure poverty thresholds in 2023. This estimate is slightly larger than the estimated 2023 populations of Claremont, Concord, Laconia, and Portsmouth combined. That total number of people in poverty included about 20,000 children and 21,000 older adults.
The overall poverty rate in New Hampshire was 7.2 percent, according to the Official Poverty Measure, which was the same estimated rate as 2022 and 2021, and statistically indistinguishable from the 7.3 percent poverty rate from 2019. The poverty rate for children was 8.0 percent, which was statistically indistinguishable from the 2022 rate. Poverty for older adults, at an estimated 7.6 percent, was also substantially unchanged from 2022, but remained higher than it was in 2019.
New Hampshire had the lowest Official Poverty Measure poverty rate among the states, with Utah’s 9.0 percent and both Colorado’s and Minnesota’s 9.3 percent rates as the next closest estimates. However, other measures of hardship, also published by the U.S. Census Bureau in September, complicate that conclusion. Using the Supplemental Poverty Measure, which adjusts for certain expenses, taxes and noncash benefits, household compositions, and geographic differences in housing costs, New Hampshire’s 7.4 percent poverty rate for the 2021-2023 period was higher than Maine’s 5.9 percent; Maine’s rate was statistically tied for the lowest in the country with several other states, including Minnesota and South Dakota. The Supplemental Poverty Measure, while not a replacement of the Official Poverty Measure, can capture key economic conditions impacting household well-being that are missed by the Official Poverty Measure, such as the reduction of child poverty by half in 2021 due largely to the expansion of the Child Tax Credit.
Within the Official Poverty Measure data for New Hampshire, 2023 continued to show longstanding differences in economic hardship between groups, reflecting both historical and present-day barriers to opportunity that hinder upward mobility. While data limitations prevent a reliable, comprehensive analysis of 2023 data, the estimated poverty rate for Granite Staters identifying as of two or more races was higher than for white residents who did not identify as Hispanic or Latino. The poverty rate for New Hampshire residents who identified themselves as Asian was lower than for non-Hispanic white residents. Data to be published in December 2024 will provide more reliable insights into the well-being of groups and geographies within the Granite State.
Other Key Data
Beyond these topline numbers, the American Community Survey provides a wealth of information on the lives and well-being of Granite Staters. For example, about 51 percent of the estimated 149,626 renter households in New Hampshire paid more than 30 percent of their incomes on rent and utilities during 2023. About 13 percent of workers age 16 and over commuted out of state for employment, while about 16 percent worked from home. Income inequality, as measured by the Gini Index, is not higher than it was just before the COVID-19 pandemic, but is higher than it was in 2010. These data, as well as other information recently provided by the U.S. Census Bureau, provide additional insights into the well-being of Granite Staters.
– Phil Sletten, Research Director