By Carsey School of Public Policy
In this brief, authors Kenneth Johnson, Dante Scala, and Andrew Smith discuss demographic forces that are reshaping the New Hampshire landscape.
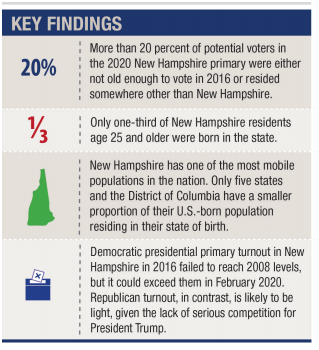
They report that more than 20 percent of potential voters in the 2020 New Hampshire primary were either not old enough to vote in 2016 or resided somewhere other than New Hampshire. New Hampshire has one of the most mobile populations in the nation.
Only a third of New Hampshire residents age 25 and older were born in the state. Democratic presidential primary turnout in New Hampshire may hit record highs in 2020. Republican turnout, in contrast, is likely to be light, given the lack of serious competition for President Trump.
DOWNLOAD THE BRIEF
KEY FINDINGS
More than 20 percent of potential voters in the 2020 New Hampshire primary were either not old enough to vote in 2016 or resided somewhere other than New Hampshire.
Only one-third of New Hampshire residents age 25 and older were born in the state.
New Hampshire has one of the most mobile populations in the nation. Only five states and the District of Columbia have a smaller proportion of their U.S-born population residing in their state of birth.
Democratic presidential primary turnout in New Hampshire in 2016 failed to reach 2008 levels, but it could exceed them in February 2020. Republican turnout, in contrast, is likely to be light, given the lack of serious competition for President Trump.
The time-honored symbol of the New Hampshire presidential primary, in which 540,000 people participated in 2016, is the laconic Yankee with deep ancestral roots in the state who dismisses fourth-generation residents as newcomers. Certainly, such voters exist, but most Granite State residents arrived only recently, and in fact New Hampshire’s population is among the most mobile in the nation: two-thirds of residents age 25 and older were not born in the state.
Such migration, coupled with the natural change in the population as young voters come of age and older generations of voters pass from the scene, has produced considerable turnover in the voting population. More than 20 percent of potential voters this year were either not old enough to vote in 2016 or resided somewhere other than New Hampshire. Such demographic turnover contributes to the changing political landscape of the state, and it has important implications both for the presidential primary and the November general election.
While the 2016 primary saw Republican turnout spike and Democratic turnout slump, the 2020 primary should be a different story. Thus far, President Trump’s competition for the Republican nomination is minimal, and many of the Granite State’s “undeclared” voters are likely to ask for Democratic ballots in order to participate in that party’s more competitive contest. The very large field of Democratic candidates, plus overall Democratic voter enthusiasm, also will boost participation. Record Democratic turnout, eclipsing the 2008 mark, is quite plausible.
Demographic Trends
Two powerful demographic forces are reshaping the New Hampshire electorate. The first is migration. New Hampshire has one of the most mobile populations in the nation, with only 44 percent of the state’s U.S. born population having been born in the state. In contrast, nationwide 66 percent of the U.S.–born population resides in the state in which they were born. Only five states and the District of Columbia have a smaller proportion of their native-born population living in their state of birth. Among those 25 and older, who make up the bulk of the voting-age population, just 33 percent of New Hampshire residents were born in the state.
As the impact of the Great Recession has waned, movement of population within the United States and New Hampshire has increased, and there is a considerable flow of migrants to and from the Granite State. Between 2016 and the time of the New Hampshire primary in February, we estimate that 200,000 people will have moved to New Hampshire from elsewhere in the United States. A few of these domestic migrants have died, but most have remained, and we estimate that 160,000 are U.S. citizens of voting age. An estimated 22,000 people moved to New Hampshire from abroad. Most were immigrants, but roughly 8,000 were returning U.S. citizens.
During the same period, an estimated 175,000 people moved out of New Hampshire to another state, and we estimate that 150,000 of these were citizens of voting age. In all, as many as 310,000 potential voters moved in or out of New Hampshire during those four years—a substantial change for a state with an electorate of only 1,082,000.
The largest source of new migrants to New Hampshire is Massachusetts, but New Hampshire also receives a significant number of migrants from the other states in the Northeast and from the South. Migrants to New Hampshire include many families with children who settle in the state’s urban and suburban regions, as well as 50–69-year-olds who relocate to the state’s recreational and amenity areas.
A second demographic force influencing the electorate is life-cycle change among the population. Between 2016 and 2020, 69,000 New Hampshire citizens celebrated their 18th birthday, and these young voters have the potential to change the political calculus of elections if their attitudes differ from those of older, more established voters. The influence of these younger voters is heightened by the loss to mortality of 46,000 older New Hampshire residents of voting age.
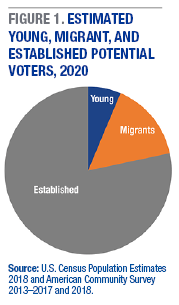
Together, the migrants and those turning 18 in the past four years represent 230,000 potential new voters or about 20 percent of those eligible to vote in 2020 (Figure 1). A similar analysis comparing the 2008 and 2016 electorates found that more than 30 percent of those eligible to vote in the 2016 primary had not been part of the 2008 electorate. Some of these potential voters will not register or vote, but those who do represent a substantial proportion of those casting ballots. Comparing these new potential voters with the established population of the state demonstrates how demographic change may affect the upcoming primary.
Young Voters Differ From Migrants and Established Voters
The influx of potential voters to New Hampshire has significant implications because their political ideology and party identification may differ from that of long-time residents. We divide the potential voters into three groups. Young potential voters are residents who are citizens and turned 18 after 2015. Migrants are potential voters who have moved to New Hampshire since 2015. Established potential voters are those eligible to vote in New Hampshire in 2015 who still reside in the state in 2020. We also consider the implications of the mortality losses between 2016 and 2020 for the electorate that will vote in the primary next year.
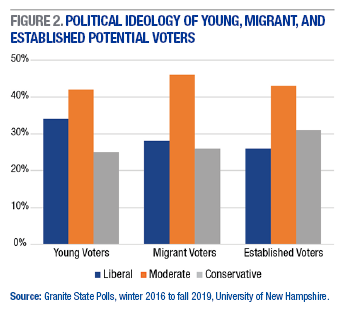
A matter of particular interest in the upcoming presidential primary is the difference between the political ideologies of the three groups of voters. The majority of each group self-identify as moderates, according to an analysis of the University of New Hampshire Survey Center’s Granite State Polls. But young voters are more likely to have a liberal ideology than migrants or established voters: nearly 34 percent of young voters classify themselves as liberal, compared to 28 percent of migrants and 26 percent of established voters (Figure 2). Established voters are more likely to classify themselves as conservative (31 percent), compared to young voters (25 percent) and migrants (26 percent).
Among recent migrants, 31 percent identify as Republicans compared to 36 percent of established voters and 35 percent of young voters. (Figure 3). Migrant voters are also more likely than young or established voters to identify as independents. In contrast, there is little difference in the proportion who identify as Democrats.
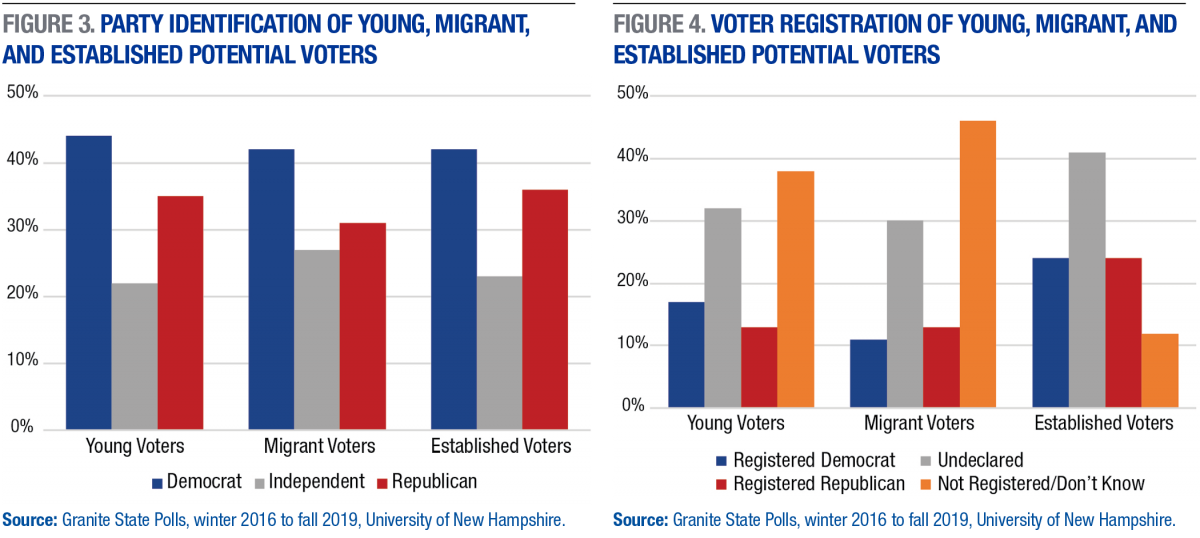
Although stated preferences of young potential voters differ from those of established residents and migrants, this distinction has yet to be fully reflected in voter registration data. Voters in New Hampshire can conceal their partisan identity by registering themselves as “undeclared.” These voters are often described as independents, but most in fact identify with one major party or the other. For example, only 17 percent of young voters are registered as Democrats, yet 44 percent identify themselves as such (Figure 4).
Similarly, the 13 percent of young potential voters who have registered as Republicans is considerably less than the 35 percent who identify as Republicans. This is unsurprising as voters only need to register as a member of a political party if they want to vote in a primary election, and these voters can immediately re-register as “undeclared” before they leave the polling place. In addition, young voters have had far fewer opportunities to vote in primary elections than older voters. Young voters are the least likely to have registered to vote in the first place (just 61 percent have done so), and among those who have, most registered as undeclared.
The trends are even more striking among migrants. Fewer than 11 percent have registered as Democrats and 13 percent as Republicans, although many more identify with each party. Some 30 percent are registered as undeclared and nearly 46 percent are not registered. Established potential voters are the most likely to be registered (88 percent), and, although many register as undeclared, they are also the most likely to have a party affiliation. Among those who are registered, 24 percent registered as Democrats and 24 percent as Republicans.
So far, we have examined three important groups that will be voting in New Hampshire in 2020. To understand how demographic forces are changing the state, we also need to consider a group that will not be voting in 2020. More than 46,000 residents who could have voted in 2016 will have died by 2020. Roughly two-thirds of them were age 70 or over. Historically in New Hampshire, older voters tend to be more conservative and more likely to vote Republican than their younger counterparts.
Using data from 2012 to 2015, it is possible to compare voters at the greatest risk of mortality to those with minimal mortality risk. These data suggest that those age 70 and older in 2016 were significantly more likely to identify with the Republican Party than were those under the age of 70. These older adults were also significantly more likely to identify with a conservative political ideology than younger voters. As this older generation fades from the scene, a larger proportion of the established voters are baby boomers, who are now mostly in their 60s. This large cohort of baby boomers is more liberal and most likely to identify with the Democratic Party than any New Hampshire age group, except the young voters considered earlier.
The changing political landscape in New Hampshire is shaped in part by powerful demographic forces of change. More than 20 percent of the population eligible to vote in the state in 2020 was either not here or too young to vote in 2016. In addition, mortality has further diminished the older generations of voters long associated with New Hampshire’s traditional role as a bastion of Yankee Republicanism.
Therefore, candidates campaigning in New Hampshire as well as political commentators should be careful about characterizing New Hampshire based solely on what happened in past primaries. More than 20 percent of the voters eligible to cast ballots in 2020 could not have participated in the 2016 primary, and roughly half the current electorate could not have voted in 2008.
The changing demographic landscape also underscores the need for political pollsters tracking New Hampshire voting trends to carefully assess their sampling methods. The high percentage of new and migrant voters means that pollsters must be careful to draw samples that do not systematically exclude these recent additions to the New Hampshire voting population. While many pollsters rely on past voter list samples for their polls because these are less expensive, recent analysis suggests this sampling methodology is significantly biased against migrants and young voters. Pollsters using listed samples routinely underestimated support for Bernie Sanders in 2016 as young voters were much more likely to vote for him than Hillary Clinton.
The Trump Effect? Turnout for the 2016 Republican Primary
The 2016 Republican primary was a raucous affair in the Granite State. Multiple candidates crisscrossed the state holding traditional town meetings, but 2016 will be remembered for the massive rallies in support of Donald Trump. Local Republican elites mostly scorned the businessman-turned-reality-television star, but a plurality of voters ignored their counsel. Trump finished with 35 percent, more than twice the amount of Ohio Governor John Kasich, his nearest competitor, beginning a streak of primary victories that ultimately led to his party’s nomination.
Whether it was the Trump effect, the attention showered on voters by multiple candidates, or simply the Republican desire to regain the White House after eight years of Democratic rule, voters turned out in droves. Primary turnout spiked in 2016 after 12 years of stagnancy (Figure 5).
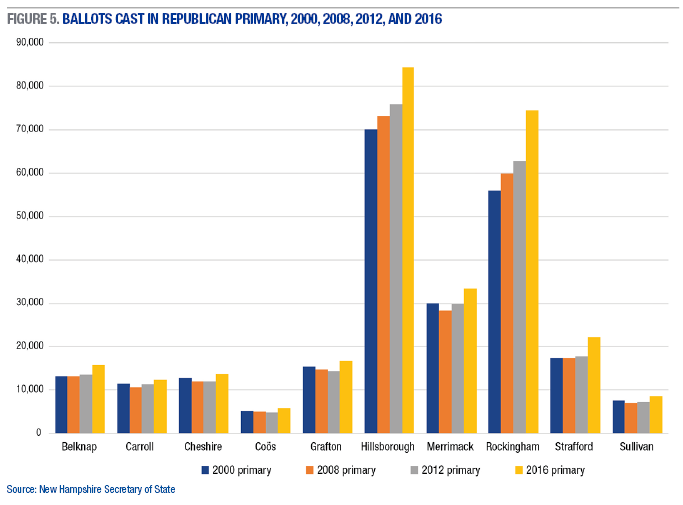
In 2000, nearly 240,000 turned out for the Republican primary, in which Arizona Senator John McCain defeated Texas Governor (and eventual nominee) George W. Bush. Eight years later, McCain triumphed again in the Granite State on the way to his party’s nomination, but overall turnout increased less than 1 percent and trailed Democratic turnout significantly. Four years later, former Massachusetts governor Mitt Romney cruised to victory in his second bid to win the first-in-the-nation primary, but Republican turnout ticked upward less than 4 percent.
The year 2016, however, was a different story for New Hampshire Republicans. As Barack Obama prepared to leave office at the end of his second term, more than 287,000 participated in the Republican primary, a 15 percent jump from 2012. GOP primary turnout swelled in every county of the Granite State, but a few surges were especially noteworthy.
Coös County, which sits on New Hampshire’s northern tip, contains the smallest population in the state and has long suffered from economic decline. The county moved in a Democratic direction in recent electoral cycles: John Kerry carried the county in 2004, and Obama did so in 2008 and 2012. Republican presidential primary turnout in Coös decreased below 5,000 in both 2008 and 2012. In 2016, however, this trend reversed. GOP primary turnout increased in the county by 24 percent, the second-highest rise in the state. Trump carried the county by 21 percentage points in the primary—one of the first concrete signs that he was building strong bonds with white working-class voters. A similar scenario played out in rural Sullivan County, on the border of Vermont, where Republican primary turnout increased 19 percent.
Strafford County, home of the University of New Hampshire, has been a Democratic stronghold for decades. But in 2016, Strafford had the highest spike in Republican presidential primary turnout, 25 percent higher than 2012. The Republican surge took place both in Durham, home of the University of New Hampshire, as well as in an assortment of wards in old mill cities (Rochester and Somersworth) and small rural towns in the northern part of the county.
Rockingham County, in the southeastern corner of the state along the Massachusetts border, continued in the last election cycle to assert itself as a foundation of the modern-day New Hampshire Republican Party. Primary turnout rose there by 19 percent over 2012, and more than one of four Republican primary votes came from Rockingham in 2016. Combined with neighboring Hillsborough County, the most populous county in the state, more than 55 percent of primary voters hailed from these two counties on the Massachusetts border. The transition of the New Hampshire GOP from a rural party to a suburban/exurban party continues apace.
The Post-Obama Slump? Turnout for the 2016 Democratic Presidential Primary
The 2016 New Hampshire Democratic presidential primary will be remembered as a triumphant moment for Vermont Senator Bernie Sanders, who defeated eventual nominee Hillary Clinton by more than 20 percentage points. While the Sanders campaign was noteworthy for the fervor it inspired among the young, overall Democratic turnout in New Hampshire was somewhat muted (Figure 6).
More than a quarter million participated—the second-highest ever for a Democratic presidential primary—but still less than the nearly 288,000 who cast votes in the Republican primary and 12 percent less than the record-setting turnout in 2008, when Clinton defeated Obama and set into motion a months-long battle for the presidential nomination. In retrospect, eight years of Democratic control of the White House may have dulled the allure of participating in the primary to choose Obama’s successor. Democratic primary turnout declined nationally from 19.5 percent of eligible voters in primary states to 14.4 percent, according to the Pew Research Center.
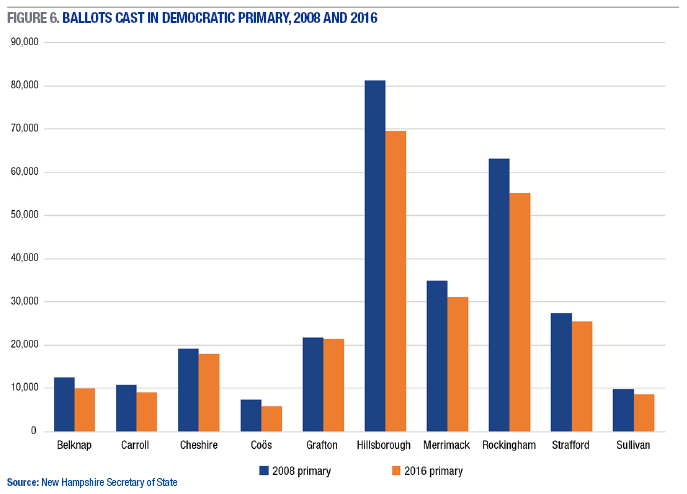
As with Republican turnout, county-level variations in turnout were revealing in 2016. The smallest declines in Democratic turnout occurred in the most Democratic-tilting counties in the Granite State. Of particular note are Cheshire and Grafton Counties, which sit at the southern and northern ends of the Connecticut River Valley. In Grafton County, home of Dartmouth College, turnout was almost identical to 2008 levels. In Cheshire, home of Keene State College, turnout declined but by less than the statewide decline. Unlike other states, rural areas of New Hampshire provide significant portions of the statewide Democratic base vote. But while the Connecticut River Valley counties showed small dropoffs in Democratic primary turnout, northern New Hampshire (Belknap, Carroll, and Coös Counties) all showed above-average declines.
Although the Democratic Party nationally is strongly identified with urban areas, more densely populated areas of New Hampshire have become slightly less significant to state Democrats in the last two decades (though they are still crucial). Twenty years ago, Hillsborough and Rockingham made up more than half of the statewide Democratic presidential primary vote, but in 2016 those two counties comprised slightly less than half of the vote. In a nation increasingly polarized along urban-rural lines, New Hampshire provides the exception: a Republican Party increasingly concentrated in relatively densely populated counties, and a Democratic Party that displays geographic diversity.
Conclusion
Measured against 2016, more than 20 percent of potential New Hampshire voters are new to the state’s electorate, making the voting population of the Granite State among the most mobile in the United States.
These younger voters and recent migrants have the potential to change the political landscape of the state in the coming presidential primary and November election. The new young voters, who along with recent migrants make up this new electorate, tend to be more liberal and less likely to identify with the Republican Party than their older contemporaries, whose ranks have been diminished by mortality since the 2016 election. At the county level, New Hampshire Democrats are making significant inroads in rural areas, while Granite State Republicans are increasingly concentrated proximate to the Massachusetts border.
These demographic changes have significant implications for the upcoming presidential primary and the subsequent November election. In addition, because President Trump is widely expected to win his primary easily, the state’s “undeclared” voters, who are eligible to vote in either party primary, mostly will choose to participate in the competitive Democratic primary, thus adding one more factor to an unpredictable mix. Despite the volatility in current primary voter preferences, the signs predominantly point to heavy, perhaps even record, Democratic turnout in February.
Data
Demographic data for this study come from the U.S. Census Bureau’s American Community Survey (ACS) of 2013–2017 and 2018 and from the 2018 Population Estimates series. The migration estimates derived from the ACS and Population Estimates data should be interpreted with caution. Although ACS data are comprehensive, they are based on samples and thus are subject to sampling error.
The New Hampshire primary will not occur until February 2020, so some of the demographic change that will impact it has yet to occur. We have estimated the demographic change for this contemporary period based on past demographic trends; these estimates are likely to be reasonably accurate, but they remain estimates subject to some error.
Also, an unknown number of in-migrants to New Hampshire during the study period later left the state, and a modest number of in-migrants will have died by 2020. In addition, a small but unknown number of New Hampshire residents emigrated from the United States during the study period. We have estimated the impact of these factors in our modeling, but their exact numbers are unknown. For an analysis of recent demographic trends in New Hampshire and a detailed discussion of methods, see the Carsey School of Public Policy issue brief, “New Hampshire Demographic Trends in an Era of Economic Turbulence.”
The Granite State Poll is a quarterly telephone survey of randomly selected New Hampshire adults. The sample is drawn using random digit dialing so each household in New Hampshire has an equal probability of selection. Data from the Granite State Polls from winter 2016 to fall 2019 were combined (GSP 60-75). The sample size was 10,076, and the data were weighted to properly represent various subgroups of the population.
Presidential primary voting data come from the New Hampshire secretary of state.
ENDNOTES
1. K.M. Johnson, “New Hampshire Demographic Trends in an Era of Economic Turbulence,” Carsey Regional Research Issue Brief No. 59 (Durham, NH: Carsey School of Public Policy, University of New Hampshire, 2019).
2. K.M. Johnson, D. Scala, and A. Smith, “First in the Nation: New Hampshire’s Changing Electorate,” National Issue Brief No. 96 (Durham, NH: Carsey School of Public Policy, University of New Hampshire, 2016).
3. To fully document the impact of demographic change on the New Hampshire electorate, it would be necessary to know the political preferences of the 150,000 voting-age migrants who left the state between 2016 and 2020. However, no data exist on these out-migrants, so we are unable to assess the impact their outmigration has on the political landscape of the state. Roughly 46 percent of the voting-age out-migrants from New Hampshire were between the ages of 18 and 29. An additional 26 percent were between 30 and 49, and the remaining 28 percent were age 50 and over.
4. For a more detailed look at the geography of the New Hampshire Republican Party, see D. Scala, “Changes in New Hampshire’s Republican Party: Evolving Footprint in Presidential Politics, 1960–2008,” Issue Brief No. 30 (Durham, NH: Carsey Institute, University of New Hampshire, 2011).
5. Drew DeSilver, “Turnout Was High in the 2016 Primary Season, But Just Short of 2008 Record” (Washington, DC: Pew Research Center, 2016), https://www.pewresearch.org/fact-tank/2016/06/10/turnout-was-high-in-the….
ACKNOWLEDGMENTS
The authors acknowledge the research assistance of Kristine Bundschuh of the Sociology Department at the University of New Hampshire. Dr. Johnson’s research was supported, in part, by his Andrew Carnegie Fellowship. The content is solely the responsibility of the authors and does not represent the official views of the agencies sponsoring this research, the Carsey School of Public Policy, or the University of New Hampshire.
ABOUT THE AUTHORS
Kenneth M. Johnson is senior demographer at the Carsey School of Public Policy, Class of 1940 professor of sociology at the University of New Hampshire, and an Andrew Carnegie fellow.
Dante J. Scala is professor of political science at the University of New Hampshire and a fellow at the Carsey School of Public Policy.
Andrew Smith directs the Survey Center at the University of New Hampshire and is a professor of practice in political science at the University of New Hampshire.
Related Links
First in the NationCategories: New HampshireTopics: DemographyNew HampshirePolitics and Elections