
By Bob Charest,
Why You Should Care NH
Remember this website: Healthyagingdatareports.org.

Bob Charest
It could be an important one in the coming months and years. A New Hampshire segment of it will be unveiled about mid-February, and when it is, it should create a splash with the kinds of things it will reveal about Granite State residents. Several people in Concord got a preview recently, and while many had questions about its ability to paint a true picture of a community, it was impressive nonetheless.
So what can it do?
What if public health advocates could pinpoint a marketing campaign to an area of New Hampshire that has a high incidence of asthma? Or lung cancer? Or suicide?
What if lawmakers were able to determine where public transportation is most needed by the elderly who no longer drive their cars but still need to get around for groceries and medical appointments?
What if regional planners were able to know what towns have the highest number of people who no longer use rooms in their homes, and they were able to match up those extra rooms with families who have no place to live?
That’s just some of the ideas passed around at a recent meeting of the New Hampshire Alliance for Healthy Aging in Concord when those present were told of the New Hampshire Healthy Aging Data Reports, which is set to roll out its New Hampshire component on Feb. 15.
The report for New Hampshire will cover 244 communities and report on 166 indicators, from things such as the number of women 60 and older who have had mammograms in the last two years (79.3 percent for the state); the percentage of those age 65 and over who have been treated for depression (28.6 percent in N.H.); to the people age 60 and over who own their own home (79.9 percent).
It’s the latest effort to use the copious amounts of data collected on all of us and put it to some beneficial use to mankind, or more specifically, New Hampshire. Underwritten by the Tufts Health Plan Foundation, the website healthyagingdatareports.org takes thousands of bits of data collected on many of us and crunches it into useful forms down to a town-by-town, even ward or precinct, level in some places.
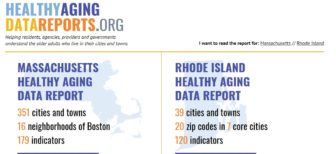
The reports are already available for Massachusetts and Rhode Island and have been for some time. According to the website, the figures and statistics “are designed to help residents, agencies, providers and governments understand the older adults who live in their cities and towns – their ages, living arrangements, health status, strengths and vulnerabilities.” The data makes it possible to compare a town or city to the rest of the state by indicator.
In fact, the roll-out version of New Hampshire’s Healthy Aging Data Report is comprised of about 40,000 pieces of data, according to its main project coordinator, Dr. Beth Dugan, associate professor of Gerontology at McCormack School for Policy and Global Studies at the University of Massachusetts, Boston.
That data comes from all types of sources, but three of the top sources include the Centers for Medicare and Medicaid Services, the Federal Census Bureau, and the FBI.
You might think data crunching is boring stuff.
The glimpse I had proves it is anything but boring.
New Hampshire is a little late to the party, its version of the website coming after it has already been in effect in Massachusetts and Rhode Island. If the experience of how the site works for those two states is any indicator, New Hampshire’s version should open some eyes.
As Dr. Dugan pointed out in her presentation:
In Massachusetts, the Middlesex County District Attorney was able to use information from the reports to target a program on elder abuse to a specific area. The information used? The towns with the highest numbers of falls and fractures among the elderly.
In Rhode Island, the legislature approved money for senior discounts on bus fare after reviewing the numbers on where public transportation was underused.
 One senior service provider expanded its offering of tai chi classes after seeing an influx of falls among the elderly in a specific community.
That’s a small sample of how these reports can be used to better understand an issue or a disease, solve a problem, or identify the issues of a town or region. Of course, these examples are heavy on the elderly population because it’s healthy AGING data, and also because I happened to be among an audience that had that demographic as its focus, but this data can be of use to younger populations as well.
Take for instance the section on behavioral health. The data can be broken down by town for people in various age groups who have reported depression, anxiety disorders, post-traumatic stress disorder, substance or tobacco use. The data is then reported as a percentage of the community, and this figure is displayed alongside the state estimate, which allows people to compare how their town fares against the state. In some instances, it’s sobering.
 And according to some of the people who attended the unveiling, it can also be misleading.
If, say, you happen to be a Concord resident and it appears to you that your city seems to have a higher incidence of chronic disease or disabilities, that could be a reflection of the fact that the city serves as home to a state hospital, a state prison, and various other assisted living communities and nursing homes.
But as Dr. Dugan notes, your community data reflects your community, and if you happen to have a dozen residential facilities located there, well that’s the community represented in the data. So let that be a caveat to those who think comparing some places with others is going to be easy. It isn’t. (It was also left up in the air if some populations, including the inmates at the state prison or patients at the hospitals, were included in the data.)
If this information seems like one big marketing study, it sort of is. Companies that are offering their products to a certain segment will do well to review this website in the future. It will help to identify their customer base.
But what about the rest of us?
If you are a politician, I suppose this would be part of your campaign research before you run for office, to help determine what your platform will be on certain issues.
If you are looking for a home, I suppose this would help you identify places with a high violent crime or homicide rate.
If you want to take a test drive of the data and its uses, go to the website at healthyagingdatareports.org. It’s active now with information for Massachusetts and Rhode Island. This will provide a glimpse of what it can do when New Hampshire comes on board in a few weeks.
And I would be remiss if I failed to mention that aside from the benefits this new form of data crunching can provide, it can also add to the discourse on how something meant to bring benefits to humankind can be abused and subverted. I can foresee people avoiding communities if it appears certain diseases or mental illnesses seem prevalent.
Dr. Dugan noted that providing the data by town or ward had to be parsed in some cases where confidentiality could be an issue.
But the maps are full of useful data: It’s possible to see where chronic disease affects a larger percentage of the population. Which towns have the highest number of people over age 65? It’s on a map. What percentage of Medicare recipients 65 and older in a certain town or city have been diagnosed with dementia? It’s on a map.
Being able to determine where the elderly live alone in greater numbers can be a revealing statistic or a welcome mat to a scammer, but we as the users of the data have to decide: Is the information worth the risk?
Dr. Dugan said the stats on living alone are of importance, especially in light of a recent study that “social isolation can be more dangerous to your health than smoking.”
One of the biggest knocks I heard on the data collection is the fact that nothing is reported about religious or spiritual participation. Some at the Alliance meeting thought that was an important indicator.
Bob Charest has been in the news business since 1977. He has worked at newspapers in Massachusetts and New Hampshire as a reporter and editor. A graduate of Boston University, he has consulted with InDepthNH.org on editing and grant proposals since before its founding in 2015. He usually writes on topics related to the intersection of technology and privacy, and how the choices we make online, or in our everyday lives, can seriously affect our entire world.